The Analytics industry, in its various forms, consistently describes the exciting opportunities that exist in delivering insights via Dashboards, Scorecards and other such mechanisms.
We tell the business that we can deliver a single page that tells them everything they need to know to about their business/process. To be honest this is what excites me and I can see great potential in these approaches.
So if this is the potential solution, why is it not the norm? Why do we deliver so many operational reports that are at a transactional level?
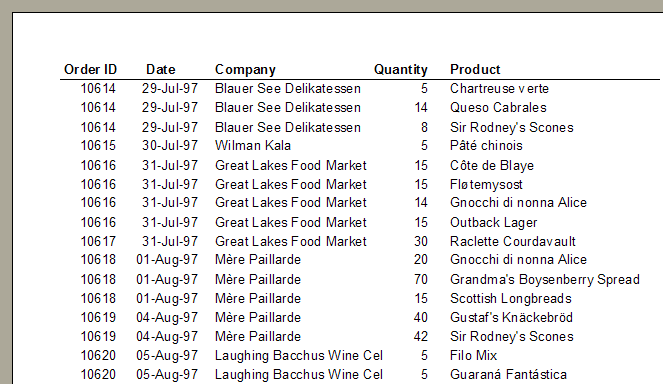
Before I go much further, here is an example of a traditional, operational report.

As you can see, it is very simple in structure and does not leverage any visual techniques to make the consumption of the information easier for the user. So lets explore why operational reports are prevalent:
- Business users are often hampered by not having access to the data they need to do their job. This means that when they’re asked for what they want, they ask for everything at the lowest level of detail, after all, when will they next get this opportunity? Inevitably the data will end up in Excel where they actually do their ‘real’ work.
- The Business users interviewed for requirements are very often ‘operational’ in their duties and therefore need operational data.
- There are trust issues, if the users ask for transactional reports, they know that they were given ‘true’ data that they can interpret. This is because it is provided without any filters, aggregation or business rules.
- In many projects, they are contracted in such a manner as to make the low risk, operational report more likely. If you have been asked to deliver 50 reports, of various flavours, on a fixed price project, you are not going to care too much about delivering sexy visualisations, there just wont be enough time.
- When dashboards have been built in the past for the business, they have not been satisfied as:
- There’s been an inability to drill to the underlying detail that underpins the particular measure, KPI or traffic light.
- When the business process changes, and the dashboard also needs to change, IT are not able to respond in a timely manner.
- The KPI definitions are not available to the dashboard user. They therefore distrust the results as they don’t know how they’ve been calculated.
- The operational meta data (i.e. when was the data last updated) is not available to support the dashboard. Users are left wondering if the data is correct.
The net result is that the dashboard is considered an expensive novelty, not entirely trusted, too slow to change and of questionable value.
What steps can we take to avoid these issues and deliver on the promise? Well here are some of my strategies.
- Always conduct an education session where the business is taken through the various types of BI. They may not even know about dashboards, scorecards, visualisation techniques, etc.
- Don’t take an either/or approach. Deliver dashboards that are underpinned by operational reports which can also be accessed directly if required.
- Always attend the requirements workshops and invite strategic thinkers who will be more interested in the alternative types of BI.
- Once you have their trust, take the business on a journey. Start to promote the idea of exception reporting. Why overload them with all the data when you can tell them what they need to know (i.e. ‘which are my underperforming business units?’). This is probably one of the toughest challenges and shouldn’t be an immediate goal.
- Encourage the establishment of a Business Intelligence Competency Centre so that the true value of the skills, technologies and techniques can be leveraged.
- Empower the business to build their own dashboards. There are many tools available now that a semi-technical person can use to build their own content in a short time period. This means it is even more important for we IT types to:
- Embed the business rules in the data, don’t expect users to calculate them in the tool.
- Create intuitive data models that are easy to use.
- Deliver clean, timely and reliable data.
I am not suggesting there isn’t a place for operational reporting, there most definitely is, what I am saying is the prevalence should be considered a warning that we are failing to deliver the value our industry can.


