This blog is an easy-to-read summary of the Query Store functionality available in Azure SQL and other versions of SQL Server.
Query Store was introduced in SQL Server 2016 and it provides insights into plan choices and performance issues.
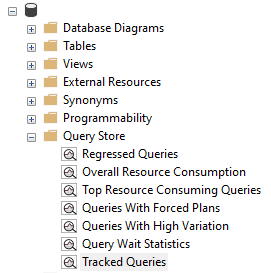
If enabled, it is available within SQL Server Management Studio via the Query Store folder:

Functionality includes:
- Maintain query plan versions. This means that queries can be optimised where they are slowed due to execution plan changes.
- Identifying and Analyzing key metrics

Key Metrics
The following are the metrics exposed by the Query Store views and can be aggregated (min, max, avg, etc.) over a chosen timescale
| CPU Time | CPU time for the query plan in ms | Duration | Duration time for the query plan in ms |
| Execution Count | Count of how many times the query plan has been executed | Logical Reads | Number of pages read from the data cache for the query plan |
| Logical Writes | Number of pages written to the data cache for the query plan | Memory Consumption | Memory grant (reported as the number of 8 KB pages) for the query plan |
| Physical Reads | Number of pages read from disk for the query plan | CLR Time | . NET Common Language Runtime engine time for the query plan |
| Degree of Parallelism | Degree of Parallelism (DOP) is the number of processors, that are assigned for the parallel plan | Row Count | Number of returned rows for the query plan |
| Log Memory | Number of bytes in the database log used by the query plan | TempDB Memory | Number of pages used in tempdb for the query plan |
| Wait times | The wait when a query moves from Runnable to Suspended for the query plan |
Views
The following views are available to the support the analysis of the plans and metrics.
| Regressed Queries | Pinpoint queries for which execution metrics have recently deteriorated |
| Overall Resource Consumption | Analyze the total resource consumption for the database based on any of the metrics. |
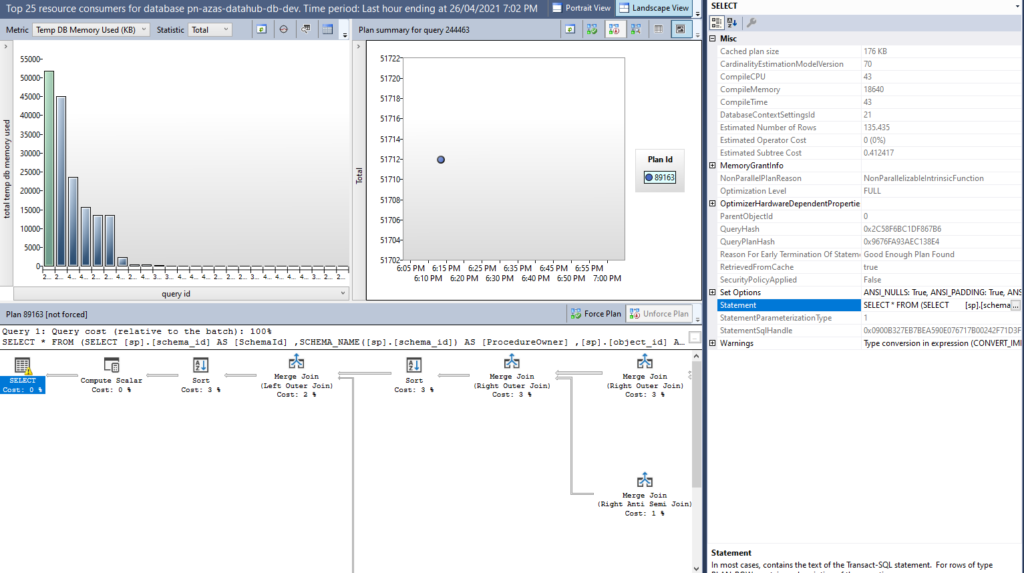
| Top Resource Consuming Queries | Choose an execution metric of interest, and identify queries that had the most extreme values for a provided time interval. |
| Queries With Forced Plans | Lists previously forced plans using Query Store. |
| Queries With High Variation | Analyze queries with a high-execution variation. |
| Query Wait Statistics | Analyze wait categories that are most active in a database and which queries contribute most to the selected wait category. |
Supporting SQL
The following SQL Statements will be useful when working with Query Store
Query ID
SELECT q.query_id, t.query_sql_text SQL_Text, object_name(q.object_id) AS parent
FROM sys.query_store_query_text t JOIN sys.query_store_query q ON t.query_text_id = q.query_text_id
WHERE t.query_sql_text LIKE N’%Load%’
Plan ID
SELECT t.query_sql_text, q.query_id, p.plan_id
FROM sys.query_store_query_text t
JOIN sys.query_store_query q ON t.query_text_id = q.query_text_id
JOIN sys.query_store_plan p ON q.query_id = p.query_id
WHERE q.query_id IN (SELECT q.query_id FROM sys.query_store_query_text t JOIN sys.query_store_query q ON t.query_text_id = q.query_text_id WHERE t.query_sql_text LIKE N’%Load%’)
Reading the Plan
Now the tricky bit!! When you find a plan in Query Store that you wish to work on, the first thing you need to decide is whether it is going to meet your performance expectations. You effectively need to read the plan. Which is beyond the scope of this post. A good place to start is here
Showplan logical and physical operators reference
Summary
In itself, this is not a solution to performance issues but will help identify them and manage the plans used. It needs to be augmented with a healthy understanding of:
- Query Plans and what they mean
- Cost of applying indexes when considering load times. Particularly with large datasets
- SQL Azure – Performance Recommendations
- Types of indexes and when to use each one (Clustered, Non-Clustered, Column Store, Text, etc.)
- Index health (e.g. degree of fragmentation)
- Maintenance of stats (e.g. are they accurate or not)


