
This post is a 101 on Python for Data Science
Libraries
Data scientists using Python rely on many libraries depending on the task at hand. Some of the commonly used libraries include Matplotlib, NumPy, Pandas and SciPy Library
Matplotlib
Comprehensive 2-D data visualisation library (e.g. Column Graphs, Line Graphs, Scatter Plots, etc.)
NumPy
Support for large, multi-dimensional arrays
Pandas
Offers data structures and operations for manipulating numerical tables
SciPy Library
Library for scientific computing in Python (e.g. Fourier Transforms, etc.)
Integrated Development Environments (IDEs)
In order to use the various libraries available, Data Scientists have to choose how they will develop their code. Using an IDE is the norm and frequently involves the use of one of the following applications:
- Enthought Canopy
- Jupyter Notebook
- PyCharm
- Rodeo
- Spyder
- Thonny
They typically provide IDE features like:
- Debug mode to step through code
- Code inspections
- Error-highlighting
- Version control
- Etc.
Commands
Pandas
Date Formatting
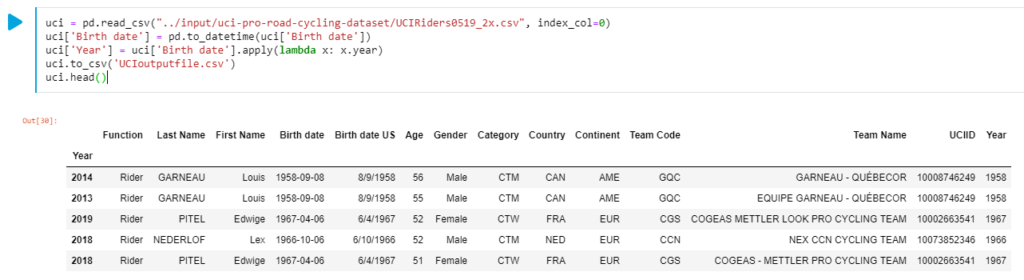
In the event that a date in the dataframe needs to be formatted or converted then use:
| Convert to datetime | datetime pd.to_datetime(uci[‘Birth date’]) |
| Extract Year | uci[‘Birth date’].apply(lambda x: x.year) |
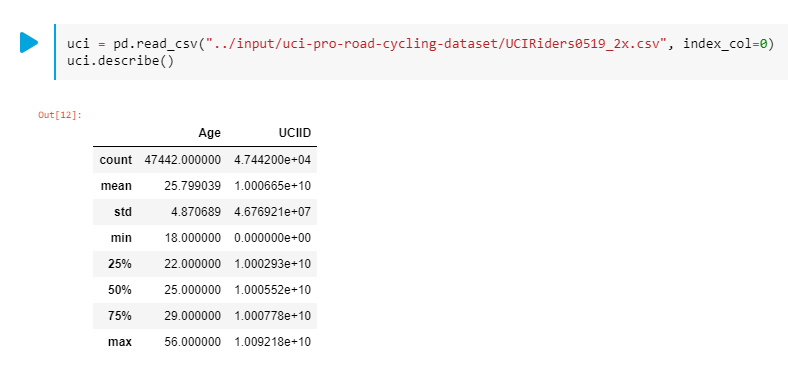
Describe
The describe command when applied to a dataframe returns statistical data that describes the data.
Export to CSV
Should you wish to export a data frame to CSV for future use:
uci.to_csv(‘UCIoutputfile.csv’)

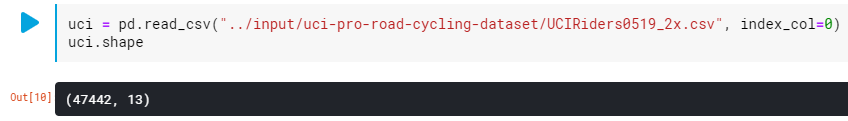
Overview
If there are many rows and/or columns and you wish to get an overview of the number then shape is the answer.
uci.shape
Metadata
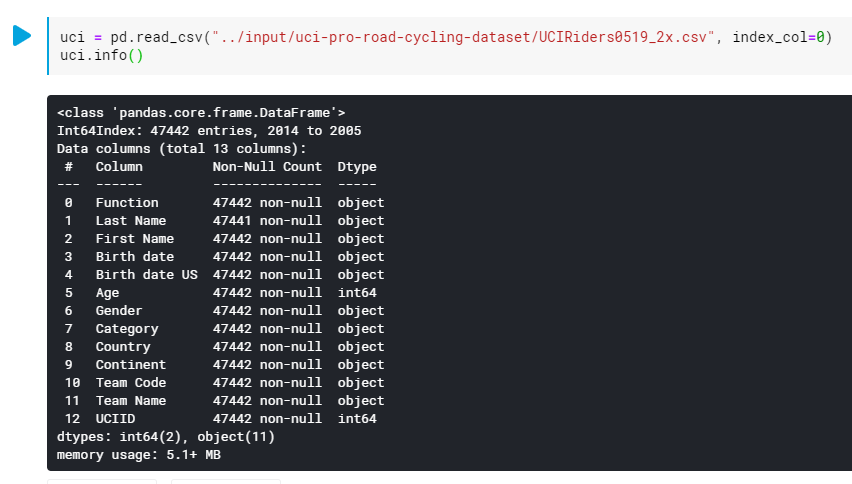
Using the .info() you can get an overview of the data types you have.
Summary of Values
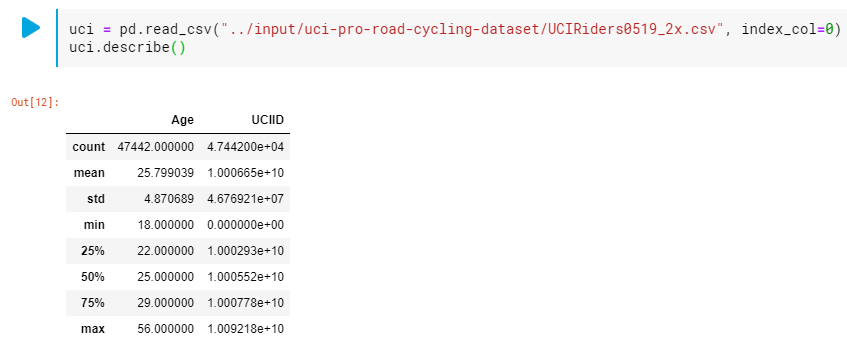
Using the .describe() you can obtain the count, mean, standard deviation, quantities, min, and max.
Post image by miniformat65 from Pixabay
